
Body Mass of Penguins
In this post, we study an example of basic data visualization in Python. We will make use of the Palmer Penguins dataset to do so.
Setup
To begin, we read the desired dataset into the pandas library, using the pandas.read_csv() function to do so.
import pandas as pd
# We can use URLs instead of local filesystem paths to access datasets with pandas
url = "https://raw.githubusercontent.com/PhilChodrow/PIC16B/master/datasets/palmer_penguins.csv"
penguins = pd.read_csv(url)
We can get an idea of the kind of visualization we might want by previewing the data:
penguins.head()
| studyName | Sample Number | Species | Region | Island | Stage | Individual ID | Clutch Completion | Date Egg | Culmen Length (mm) | Culmen Depth (mm) | Flipper Length (mm) | Body Mass (g) | Sex | Delta 15 N (o/oo) | Delta 13 C (o/oo) | Comments | |
|---|---|---|---|---|---|---|---|---|---|---|---|---|---|---|---|---|---|
| 0 | PAL0708 | 1 | Adelie Penguin (Pygoscelis adeliae) | Anvers | Torgersen | Adult, 1 Egg Stage | N1A1 | Yes | 11/11/07 | 39.1 | 18.7 | 181.0 | 3750.0 | MALE | NaN | NaN | Not enough blood for isotopes. |
| 1 | PAL0708 | 2 | Adelie Penguin (Pygoscelis adeliae) | Anvers | Torgersen | Adult, 1 Egg Stage | N1A2 | Yes | 11/11/07 | 39.5 | 17.4 | 186.0 | 3800.0 | FEMALE | 8.94956 | -24.69454 | NaN |
| 2 | PAL0708 | 3 | Adelie Penguin (Pygoscelis adeliae) | Anvers | Torgersen | Adult, 1 Egg Stage | N2A1 | Yes | 11/16/07 | 40.3 | 18.0 | 195.0 | 3250.0 | FEMALE | 8.36821 | -25.33302 | NaN |
| 3 | PAL0708 | 4 | Adelie Penguin (Pygoscelis adeliae) | Anvers | Torgersen | Adult, 1 Egg Stage | N2A2 | Yes | 11/16/07 | NaN | NaN | NaN | NaN | NaN | NaN | NaN | Adult not sampled. |
| 4 | PAL0708 | 5 | Adelie Penguin (Pygoscelis adeliae) | Anvers | Torgersen | Adult, 1 Egg Stage | N3A1 | Yes | 11/16/07 | 36.7 | 19.3 | 193.0 | 3450.0 | FEMALE | 8.76651 | -25.32426 | NaN |
Visualization
Taking from the preview above, we can analyze the distribution of body mass across all the penguins in the dataset. The plot.hist() function will help us by returning a customizable object that will display at the end of the code cell’s execution. Thus we can also use the functions set_xlabel() and set_title() to add more relevant labels to our plot:
# .plot.hist() creates a new customizable object of the AxesSubplot class
massplot = penguins['Body Mass (g)'].plot.hist()

# Label the x-axis and the whole plot with relevant text
massplot.set_xlabel('Body Mass (g)')
massplot.set_title('Distribution of Body Mass (g) Across Palmer Penguins')
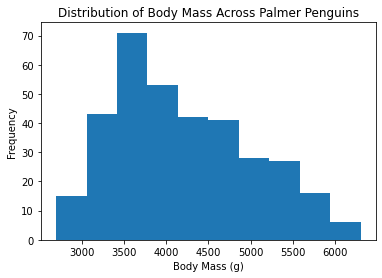
As we can see, the distribution skews right since the median is centered around the lower end of the body mass range.